your logs are lying to you
not maliciously. they just aren’t built for the truth.
you’ve been there it’s 3am, p99 latency is spiking, and you’re staring at a terminal, grepping for a user_id that might be logged as user-123, uid:123, or just inside a random json blob. you find 17 matches. none of them tell you why the checkout failed.
you found a symptom. you still don’t have a cause.
this isn’t your fault. we are still logging like it’s 2005. back then, we had monoliths. if a request failed, the stack trace was right there on the single server it hit. today? a single "checkout" button click hits multiple services, databases, caches queues. your logs are still acting like it’s a single php script.
the fix: wide events
stop treating logs as a "debugging diary" where you console.log every time you enter a function.
start thinking in wide events.
instead of 13 scattered log lines for one request, emit one massive, context-rich event per service hop.
it looks like this:
{
  "trace_id": "abc123def",
  "service": "checkout-service",
  "duration_ms": 1247,
  "user": {
    "id": "user_456",
    "tier": "premium",
    "lifetime_value": 284700
  },
  "cart": {
    "items": 3,
    "total": 15999
  },
  "error": {
    "code": "card_declined",
    "provider_reason": "insufficient_funds"
  },
  "feature_flags": {
    "new_checkout": true
  }
}
Your code could look something like this , adding detailed context to the event to create query-worthy structured logs
[app.post](http://app.post)('/checkout', async (ctx) => {
  const event = ctx.get<WideEvent>('wideEvent');
  const user = ctx.get<User>('user');

  // Add user context
  event.user = {
    id: [user.id](http://user.id),
    subscription: user.subscription,
    account_age_days: daysSince(user.createdAt),
    lifetime_value_cents: user.ltv,
  };

  // Add business context as you process
  const cart = await getCart([user.id](http://user.id));
  event.cart = {
    id: [cart.id](http://cart.id),
    item_count: cart.items.length,
    total_cents: [cart.total](http://cart.total),
    coupon_applied: [cart.coupon](http://cart.coupon)?.code,
  };

  // Process payment
  const paymentStart = [Date.now](http://Date.now)();
  const payment = await processPayment(cart, user);

  event.payment = {
    method: payment.method,
    provider: payment.provider,
    latency_ms: [Date.now](http://Date.now)() - paymentStart,
    attempt: payment.attemptNumber,
  };

  // If payment fails, add error details
  if (payment.error) {
    event.error = {
      type: 'PaymentError',
      code: payment.error.code,
      stripe_decline_code: payment.error.declineCode,
    };
  }

  return ctx.json({ orderId: payment.orderId });
});
why this changes everything when you have wide events, you stop searching for text strings. you start asking questions to structured data
- "show me all errors for premium users."
- "is the new checkout flow causing higher latency?"
- “is a specific user facing most of the issues?”
- "did this specific deployment increase db connection timeouts?"
you aren’t searching anymore. you’re running analytics on your traffic.
high cardinality fields (like user_id or cart_id) are not expensive "noise" — they are the only things that make debugging possible.
stop logging what your code is doing. log what happened to the request.
tracing: the red thread
wide events give you deep context within one service. but you don't run one service anymore. you run fifty. a request starts at your Next.js frontend, hops to an Edge Function, fans out to multiple API servers, hits the database, and triggers async jobs—all before (hopefully) returning a response.
the failure could be anywhere. it might be a malformed payload from the frontend, a timeout at the edge, or a database running too hot. without a unique ID traversing your network boundaries, you have 50 isolated crime scenes and no timeline.
the mechanics: context propagation
when Service A calls Service B, it must inject the context (usually via W3C Trace Context):
trace_id: the global transaction ID (immutable across the entire lifecycle).span_id: the ID of the current service operationparent_span_id: the pointer to who called the current operation
the contract
propagation must be absolute. if one middleware drops these headers, the graph is severed and you are back to guessing.
this is usually automatic for HTTP/gRPC, but it gets tricky at the async boundaries. if you are using Kafka or SQS, you must serialize that context into the message headers and explicitly extract it in the consumer.
logs tell you what failed. the trace tells you where the latency came from (e.g., "Service A is slow because Service C is waiting on a database lock").
you stop debugging "services" and start debugging "requests."
the result
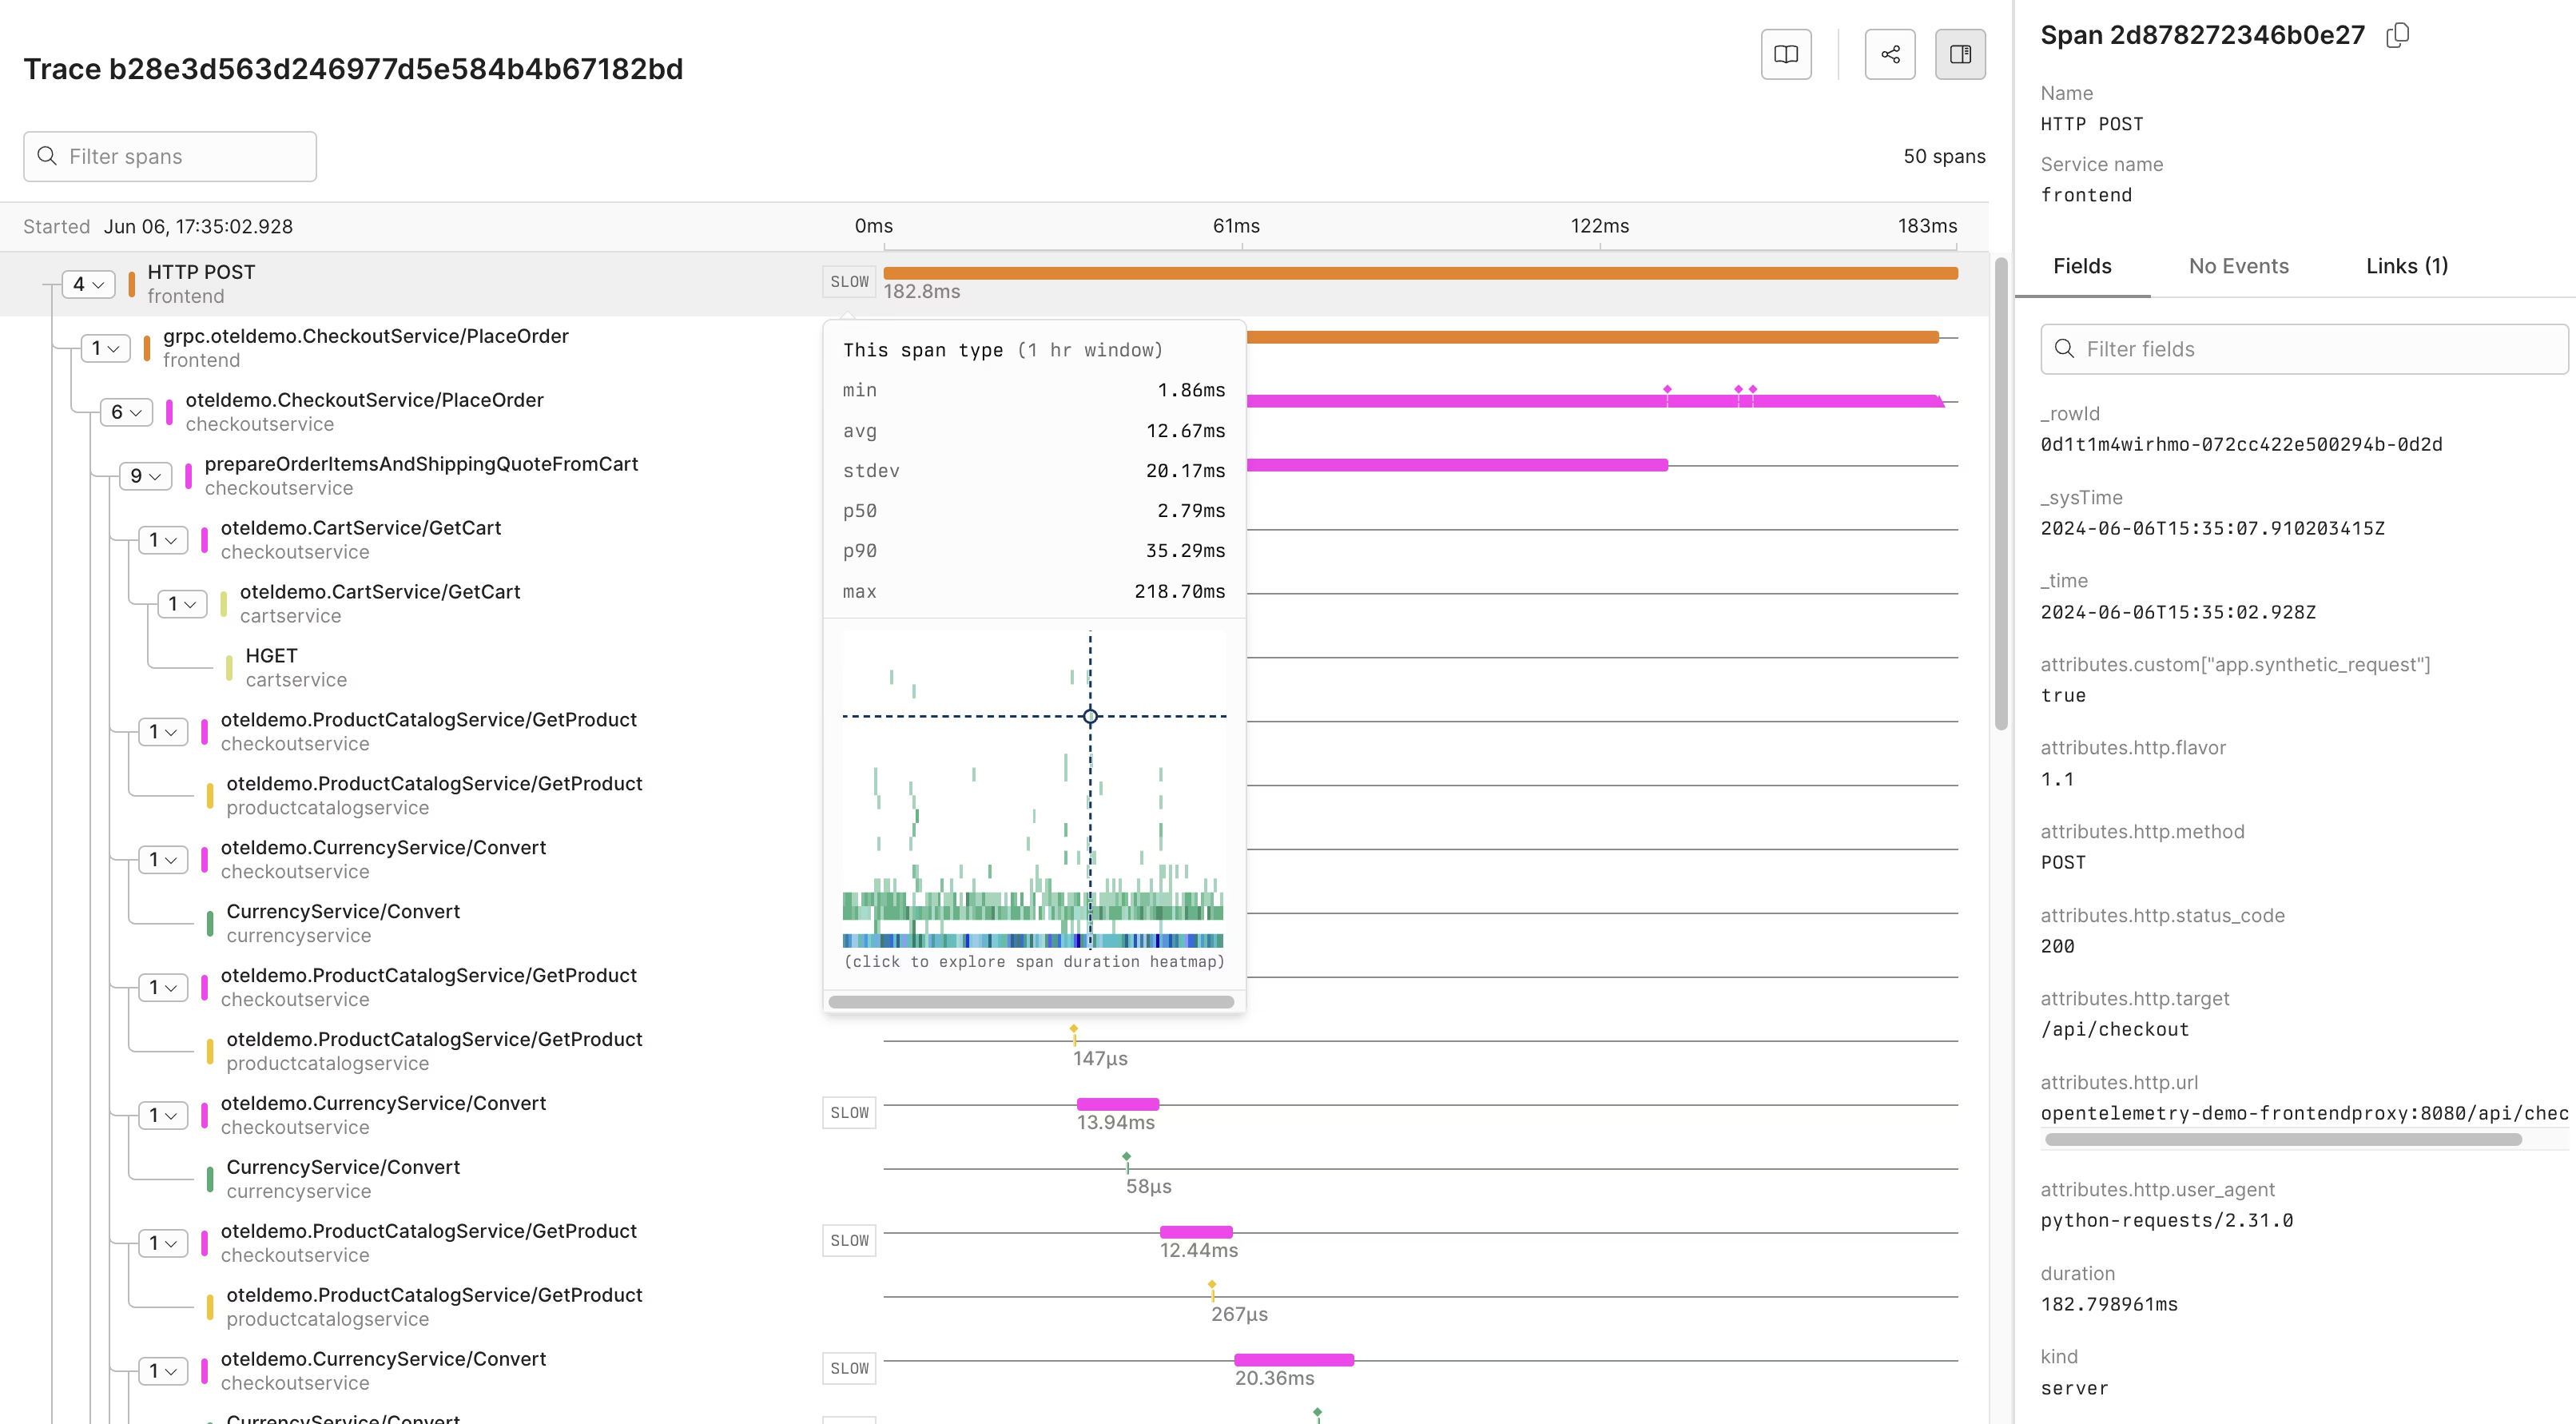
you get a detailed (quite elegant) view of the whole request lifecycle and all of the services it touches , if anything fails you now have a much easier time finding the culprit
sampling the right way
most teams realise they can't afford to log everything (although you can and it is not as expensive as you think), so they turn on "10% sampling" and call it a day.
random sampling (or "head-based" sampling) is a trap. when you randomly keep 10% of your traffic, you are mostly keeping 10% of your successes—the boring requests where everything went fine. meanwhile, the 0.1% error rate that is currently waking you up at 3am? statistically, you probably threw those logs away.
you are paying to store success stories while deleting the evidence of the crime.
the fix: tail-based sampling
don't decide to keep a trace at the start of the request. wait until the request is done. did it return a 500? keep it. did it take longer than 2 seconds? keep it. did it touch a specific new feature? keep it. was it just a boring, fast 200 OK? now you can sample that down to 1%.
this is how you scale. you don't need fewer logs; you need fewer boring logs. keep 100% of the failures and 1% of the successes. that’s how you debug production without going bankrupt.